In this article, we'll help you understand what you see in the Analytics page of your live and completed giveaway campaigns. Analytics will not update until the giveaway goes live and will be viewable for all past campaigns.
Accessing the Giveaway Analytics Page
To access analytics for a specific campaign, go to the Sweepstakes tab in the navigation bar > Find the giveaway you want to view analytics for > select Analytics.
Visits, Verified Entries, NTF Emails, Social Actions & Total Entries
1. Visits: This is the number of people who have viewed the giveaway landing page.
2. Verified Entries: This is the total number of verified emails that have entered the giveaway, driven by all brand partners. Verified means they are true emails that have passed our scrubbing filter, which scrubs out email addresses that are fake, suspicious, malicious or likely to report spam.
3. NTF emails: These are New To File email contacts. It refers to the number of email addresses that are new to your email list via your ESP. This factors in the email scrubbing tech we use. Read below for more information on NTFs.
NTF accounts for all new, unique emails collected that you have not previously received from another growth tool on DojoMojo. For example, if a person had previously entered one of your giveaways or your DojoMojo-powered signup form, then they are already subscribed to your list. These overlap emails will not be included in your NTF number, but they will be included in the "verified entries" and "total entries" analytics of sweepstakes.
For your first giveaway on DojoMojo, NTF will include the emails you contributed to the giveaway because DojoMojo doesn't know what already exists in your ESP. In other words, DojoMojo can only recognize what DojoMojo has previously sent to your ESP.
If your NTF number varies slightly from the new emails in your ESP from your giveaway, this is normal. Keep in mind that new emails are not pushed to each partners ESP instantly (this would increase unsubscribe rates if a subscriber received 4-7 welcome emails at the same time). To keep unsubscribes low and increase engagement, DojoMojo automatically pushes new emails to each partner's ESP at randomized intervals, keeping in mind that the host always receives the emails first. For example, Brand A (Host) will receive a batch of 450 new emails at 3:00 pm, Brand B may receive them at 5:00 pm, Brand C and 7:00 pm, and so on. This explains why Brand A might see 24.1k NTF emails in the Analytics but only have 22k new emails pushed to their ESP.
If you decide to download a .CSV to upload into your ESP, included in the spreadsheet of emails and other data, you will see "hygiene level" of each email. We differentiate between low, medium, and high risk. You are able to decide if you want to upload these emails or not.
4. Social actions: Social Growth actions are the buttons that appear on the Post Entry page of every giveaway. Partners often use these actions to drive traffic to their social channels. In Analytics, you'll see the total number of clicks that all social actions received, this will include every social action added (Instagram, Facebook, app download, etc).
5. Total entries: The gross number of entries to the giveaway.
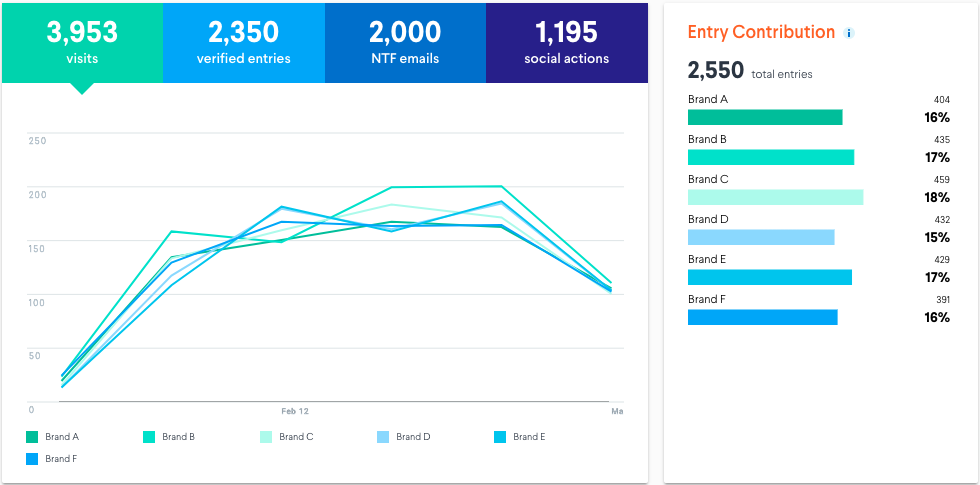
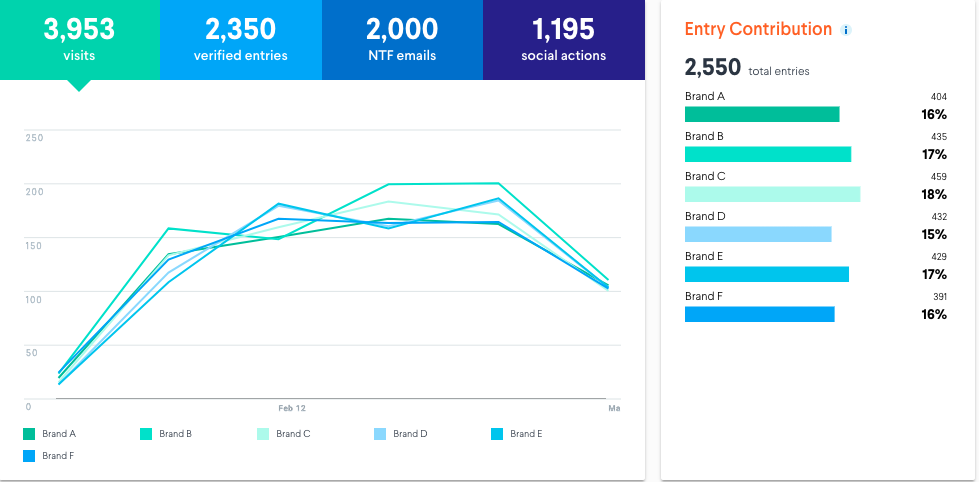
Using the graph above, let's break down each data point with real numbers (as viewed from Brand A's DojoMojo account). Note that Brand A has Email Filters turned on. We can see that the campaign was seen by 3,953 people. From these, 2,550 have entered. From the 2,550 who entered, 2,350 of them are new emails for Brand A. Because Brand A has Email Filters turned on, the email scrubbing service DojoMojo uses has determined that 350 of the new emails are "high risk" and have been taken out. Therefore, 2,000 new emails will be automatically pushed to Brand A's ESP. We can also see that the 2,550 entrants clicked on social actions about 1,195 times. In other words, because brands may include multiple social media sites (i.e. their Instagram account to follow and their App to download), it is entirely possible that some entrants clicked 2 or 3 social actions for each brand, raising this number over actual entries.
The graph also displays the timeline of promotion.
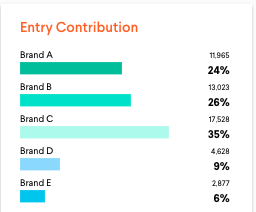
Entry Contribution By Brand
The table in this section displays how many emails each brand contributed. In other words, when each brand promoted, this number is how many of their subscribers and followers clicked on the giveaway and entered their information.
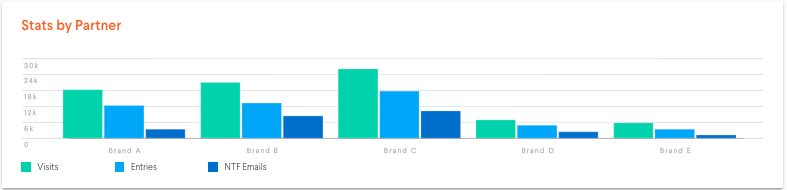
Stats By Partner
This chart breaks down how many Visits, Entries, and NTF each brand drove. By hovering over each bar with your mouse, you can see exact numbers.
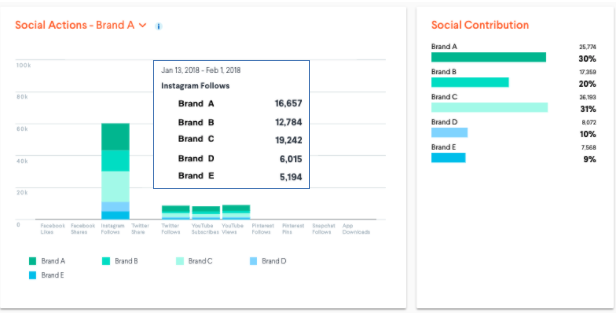
Social Actions and Social Contribution
In the graph on the left, you are able to see how each brands' subscribers clicked on your social actions. By hovering over the bar with your mouse (as shown by the outlined box), you will be shown the total number of clicks for each social action. For example, when Brand A hovers over "Instagram Follows" they will see that over 16,000 of their own subscribers clicked "Follow Brand A on Instagram." Additionally, Brand B had 12,784 subscribers who clicked "Follow Brand A on Instagram." This can help you gauge which brands' audiences find your content engaging and follow-worthy.
The chart on the right shows the total number of subscribers, per brand, who clicked on social actions. This will give you an idea of which brands' audiences are most engaged with social media.
In the top left next to Social Actions, you can click the drop down arrow and see how many social action clicks other brands are seeing.
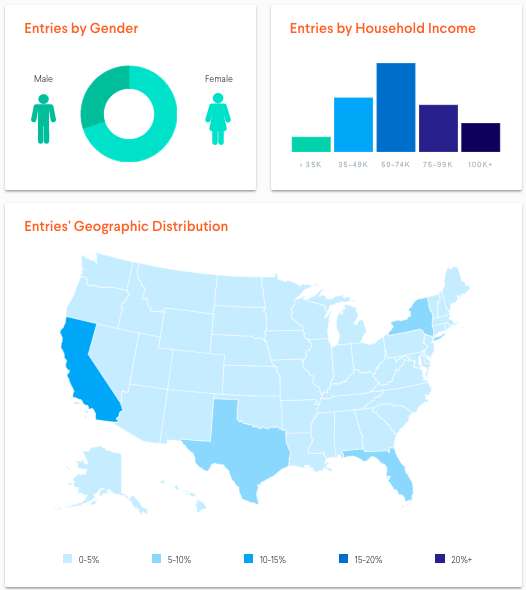
Entries by Gender, Household Income, and Geographic Distribution
DojoMojo also displays campaign analytics based on gender, household income, and geographic distribution.
Gender: This metric can be pulled from 2 ways: First, when the host is creating the landing page, they can create a box for the entrant to select their gender, in addition to first name, last name, and email address. If the campaign does not ask the entrant to select their gender but has participated in a past DojoMojo campaign where he or she did select gender, then this information will be pulled into "Entries by Gender." If the entrant is either entering a DojoMojo campaign for the first time, has entered a DojoMojo campaign before but has not selected their gender, or if the current campaign does not ask for it, then their gender information will not be included in the chart below.
When hovering over the chart with your mouse, you will be able to see the exact number of males and females who have entered. It will show a total number which will likely be less than the overall number of entrants, as explained above.
Geographical Distribution and Household: From the IP address of the entrants, DojoMojo is able to pull the geographical information down to the zip code. From this, DojoMojo finds the SES of that zip code to analyze household income data.
To see your brand's personal demographic information for entries by gender, household income, and geographical distribution, click to your brand's icon in the top right of your screen > click "View Profile."
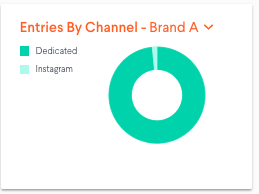
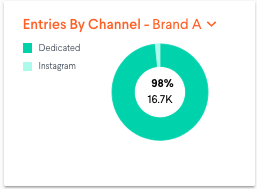
Entries By Channel
Promoting the campaign via Dedicated email send is generally what drives the most entries. Most, if not all, hosts expect all partners to promote at least once via dedicated. However, partners can promote the campaign via Newsletter and social media (including Instagram, Facebook, Pinterest, etc.).
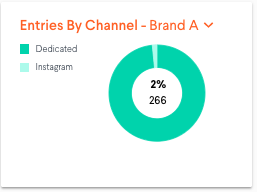
Analytics will show you exactly how many entries your brand and other partners drove via each promotion method. In order to see the exact number and percentage of emails, hover your mouse over the graphic. As shown below, Brand A received 16.7k emails from their Dedicated email promotion and 266 from their Instagram promotion. If you want to see the promotional breakdown for your partners, click the drop-down arrow next to "Brand A" at the top of the tile.
Using the correct tracking link is absolutely essential for correct analytics. If any one partner promotes, for example, the campaign in a Dedicated email send but uses the Instagram tracking link, these entries will be mis-attributed and will appear under the host's entries as "Preview Promotion." To learn more about Preview Promotion mis-attribution, click here.
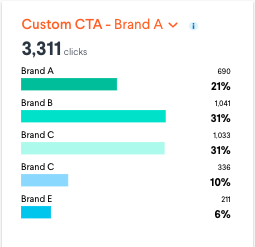
Custom CTA
Custom CTA (or Call to Action) is a feature that only Premium Plan members can access. The chart below shows how many clicks Brand A received on their CTA ad, per brand. For example, 1,041 of Brand B's subscribers entered the giveaway and clicked on Brand A's CTA ad. Additionally, 211 of Brand E's subscribers clicked on Brand A's CTA ad. At the top, you can see Brand A received 3,311 clicks overall on their CTA.
As with the other metrics, each partner can use the drop down arrow to toggle between brands and see how many clicks on CTA each brand received. However, often only one partner (or the host) retains a large portion, if not all, of this space.
To learn more about what CTA is and how it works, click here.
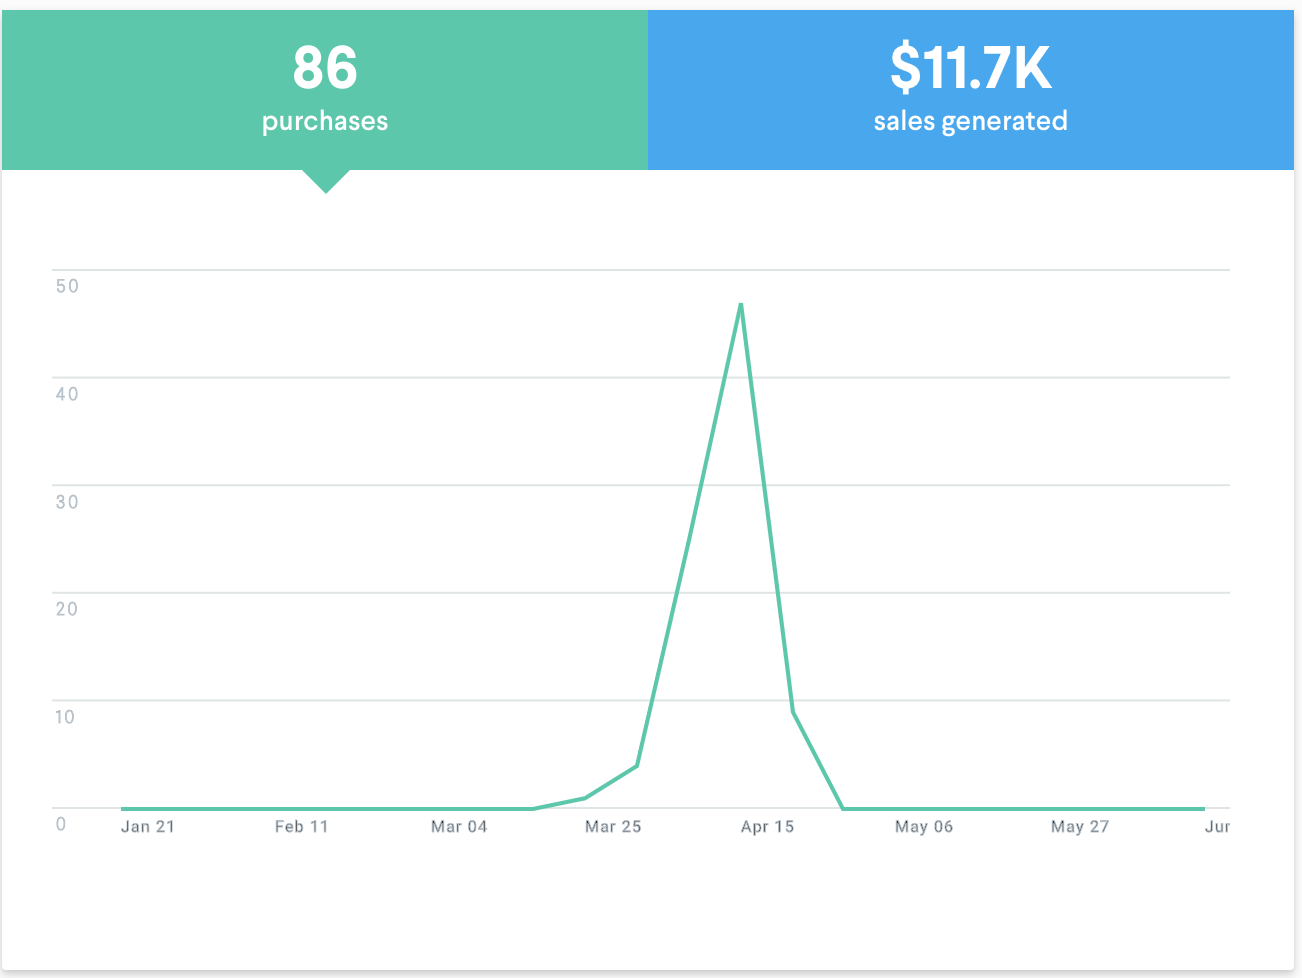
Purchases and Sales Generated
To gain access to data purchases and sales generated from entries to campaigns you participated in, you need to integrate with DojoMojo’s data integrations.
Once integrated, we look to match purchase data with entrant data to provide you the number of unique purchases and sales generated from entrants to a specific campaign within a 60-day attribution window.
Learn more about our data integrations: